Technological innovations of the last decades have revolutionized current biomedical research. High-throughput sequence data is widely adopted and many repositories provide access to large amounts of expression data. Imaging and functional analysis tools improve phenotypic cell and tissue characterization, while text mining facilitates big-data applications with increasing importance in current research. Thus, scientists and clinicians are faced with an ever-growing detail and complexity, resulting in an increasing amount of time and resources that are needed to retrieve and process the right information, which constitutes one of the major obstacles for their efficient use.
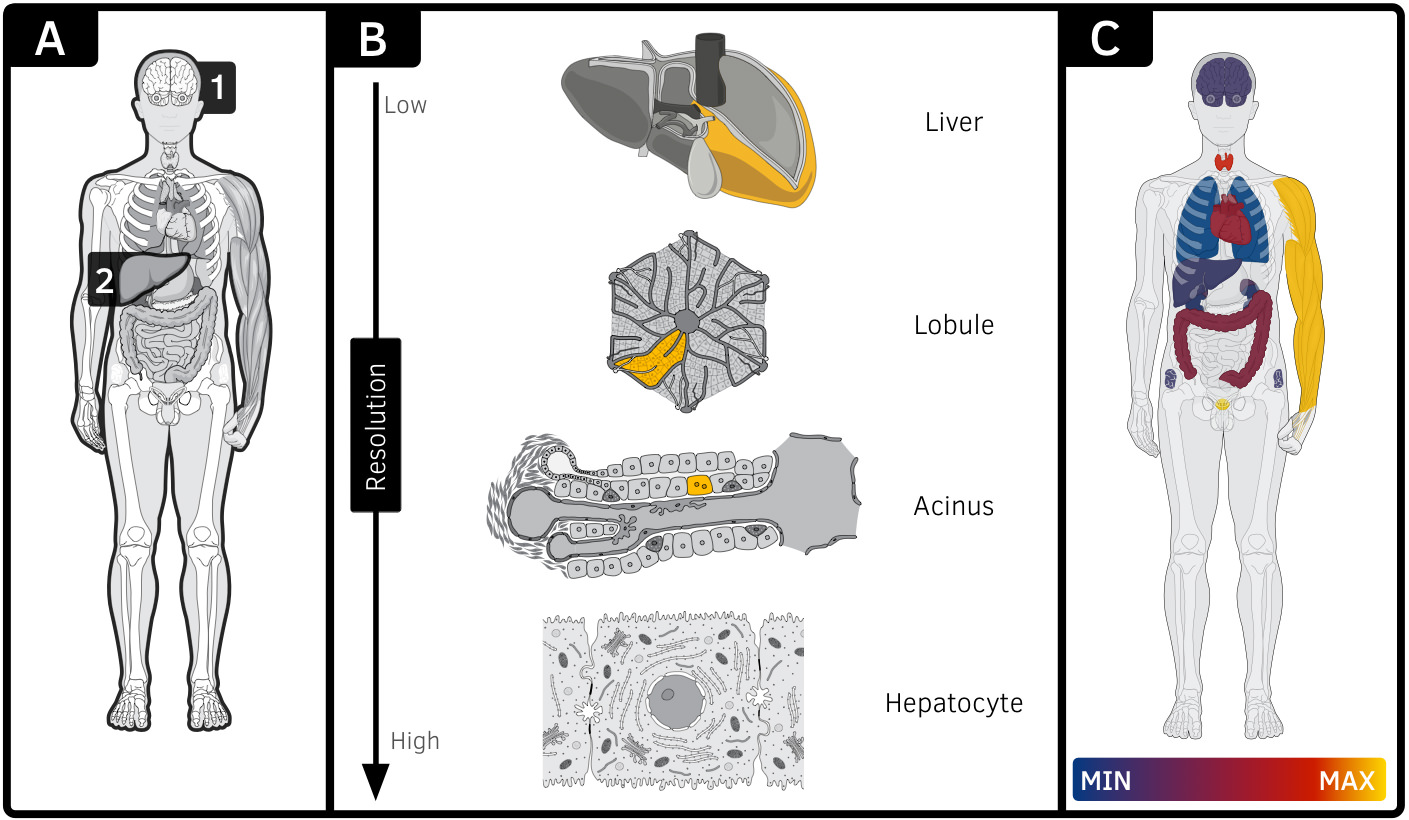
The Semantic Body Browser exploits the visual pattern recognition capability of human users to provide quick and intuitive access to a broad range of anatomical and genetic information. The anatomy of an organism’s body itself is the starting point to browse (Fig. 1A) for information associated with organs, tissues, cells or cellular structures (Fig. 1B). Besides very fundamental computer skills no preknowledge is required, to use the Semantic Body Browser. The representation of data is facilitated by means of interactive, annotated anatomical illustrations through a user-friendly web application for fast access to up-to-date computationally derived data. An organism is explored along the four dimensions: resolution/location (gross body to subcellular level), developmental stage (e.g. Carnegie stages), species (e.g. human and mouse) and gender (male and female).
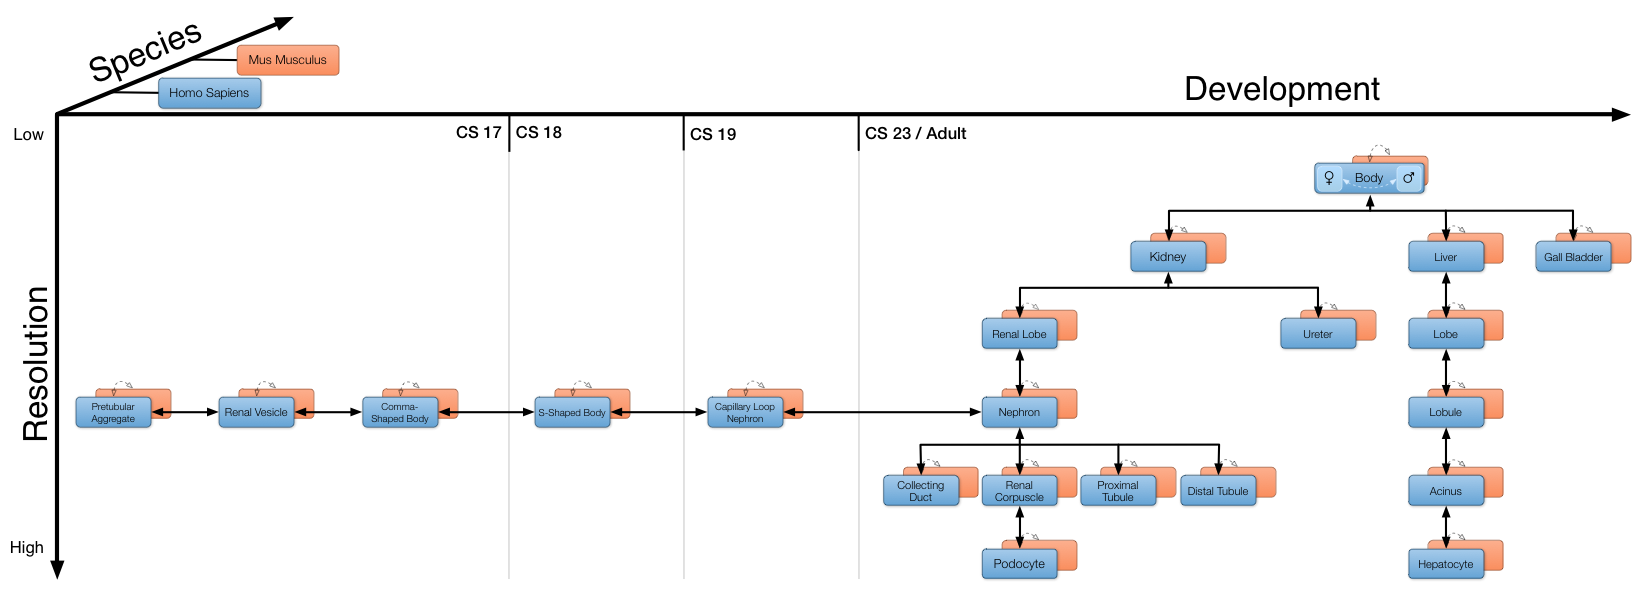
The illustrations were produced by professional biomedical illustrators and validated by experts in anatomy, pathology and cytology. Each illustration contains several biological entities that can feature a definition, synonyms, or microscopic images as points of reference. To visualize expression profiles associated with an entity, a list of genes can be defined manually using a text-based search for gene symbols. An interactive gene expression heatmap is superimposed on the illustrations to visualize spatial gene expression patterns of different biological entities (Fig. 1C). All biological entities (e.g. organs, anatomical structures, cells or subcellular components) are annotated using uniform resource identifiers provided by the Cell: Expression, Localization, Development, Anatomy ontology [1]. Currently 22 illustrations for human and 21 for mouse, featuring three organs (kidney, liver and gall bladder) are implemented, providing 12 levels of resolution (Fig. 1B), 6 developmental stages, 2 species as well as separated views of the male and female human body (Fig. 2). In addition to anatomical illustrations, the SBB features high quality microscopic pictures, linked from CellFinder [2].